Recently Microsoft provided Azure Monitor for Azure Virtual Desktop public preview version https://docs.microsoft.com/en-us/azure/virtual-desktop/azure-monitor. It is still not recommended for production workloads and being updated constantly but looks promising and already simplifying AVD monitoring a lot. Comparing to efforts creating Kusto queries, whole monitoring workbook design and other related manual steps administrators should do themselves. Azure Monitor for Azure Virtual Desktop provides built-in solution with minimal configuration.
Below you can see brief steps how to set this up, considering Azure Virtual Desktop host pool and Log Analytics workspace are already created.
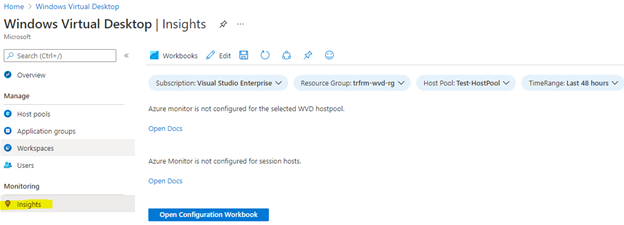
- Go to Azure Virtual Desktop blade and click on Monitoring -> Insights.
Click Open Configuration Workbook:
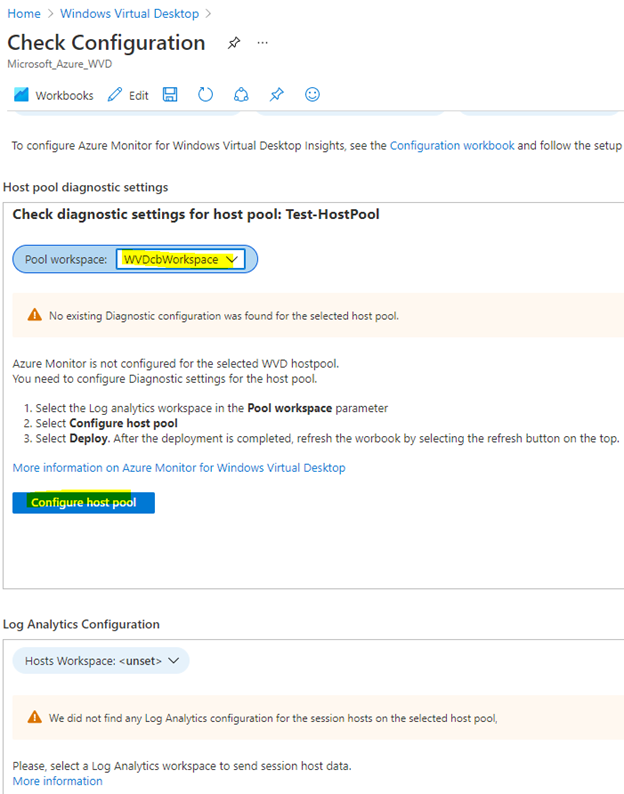
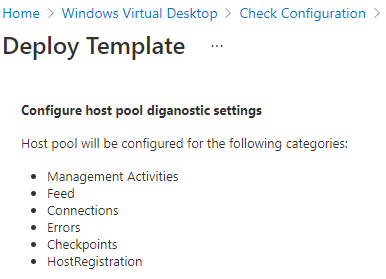
- In the Host pool diagnostics settings section, select Log Analytics workspace (Pool workspace) you are planning to use, click Configure host pool and Deploy in the next blade:

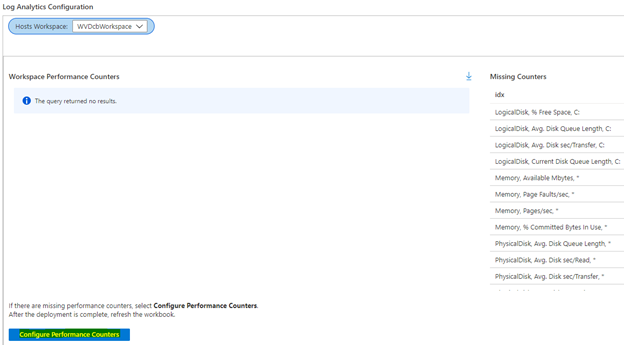
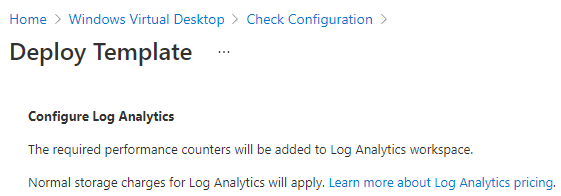
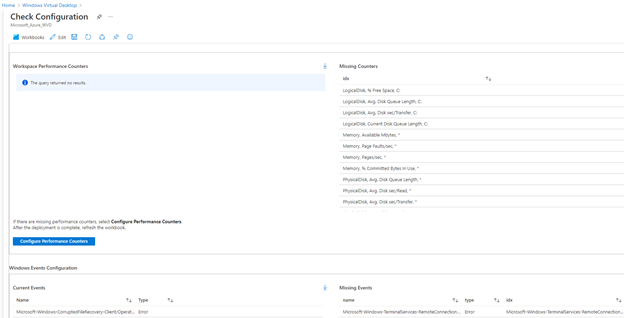
- In the Log Analytics Configuration section, select same Log Analytics workspace again. When selected, missing performance counters and events will be listed. Let’s go ahead and configure performance counters now and apply config:

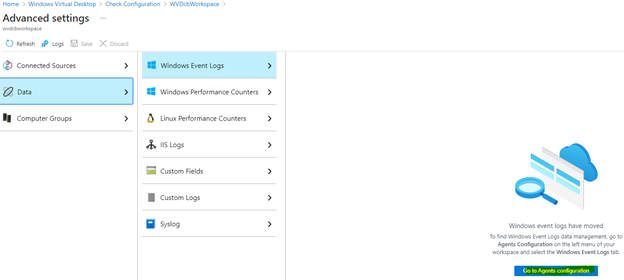
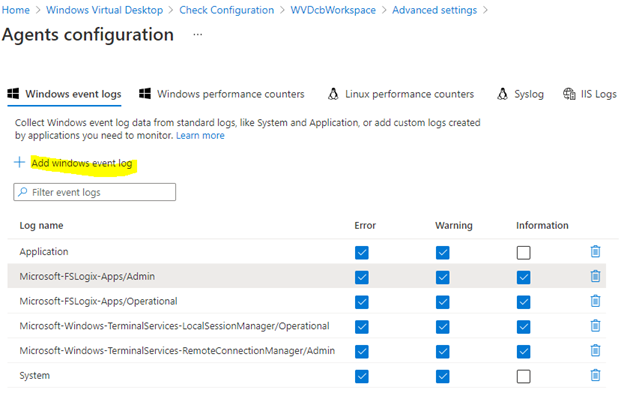
- Continue to Windows Events Configuration, click Open Workspace Configuration. Then go to Data -> Windows Event Logs -> Go to Agents configuration. Add and apply all missing logs.

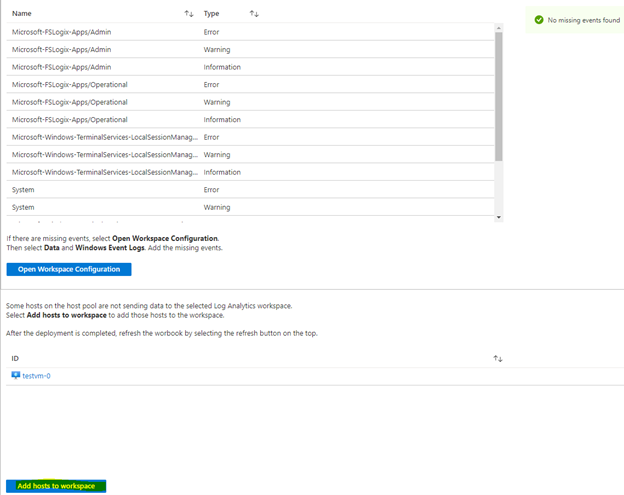
- Make sure no missing counters or events are left and proceed to the last step, which will install Microsoft monitoring agent to WVD session hosts and assigns Log Analytics workspace selected earlier:


- Completed. It must take some time, and some data needs to be collected to view proper monitoring data. Below you can see how it looks like with various diagnostic sections available. We are not going to review those in details this time. It is very likely Microsoft will adjust this workbook over time:

To minimize this configuration even more, increasing speed and consistency, we can use Infrastructure as Code (IaC). Most popular tools to achieve that are Azure Resource Manager (ARM) templates and HashiCorp Terraform, which is using a declarative configuration language known as HashiCorp Configuration Language (HCL). ARM templates are still more popular among Microsoft Azure products and Terraform among Amazon Web Services (AWS), for example, but during last couple of years Microsoft was working together with Hashicorp very closely and with Terraform you can create almost anything in Azure currently. Even we are working with ARM templates, we are starting to prefer Terraform for its simplicity and flexibility between different clouds and providers.
Terraform provide documentation - https://registry.terraform.io/providers/hashicorp/azurerm/latest/docs. Please do some additional reading or training if you are not familiar how Terraform works.
We shall focus only on the settings we have configured in the manual steps above. Again, considering AVD environment and Log Analytics workspace are already in place. Applying Terraform configuration below, missing configuration for Azure Monitor for Azure Virtual Desktop will be configured instantly. This Terraform configuration is simplified, intended only for single session host and creates only two required events and two metrics. Anyway, this should give an idea how to proceed and we advise adding missing events/metrics and adjusting variables or remaining code according AVD environment you have (our advice is to use Infrastructure as Code for the whole Azure Virtual Desktop build, not only for monitoring). Missing event/metrics can be found in the Windows Virtual Desktop -> Insights -> Open Configuration Workbook -> Log Analytics Configuration -> Workspace Performance Counters/Windows Events Configuration sections:
Existing configured events and metrics can be retrieved using below Powershell commands or Azure portal -> Log Analytics workspace name -> Agents configuration blade:
And finally, contents of Terraform configuration files:
variables.tf
main.tf
_1920x400.png)