_1920x400.jpg)
Monitoring is critical part of the IT environment. It is important to know when things go wrong, that you are able to debug, gain insights, see trends over time and use this data to help drive technical/business decisions.
You can find some good monitoring solutions available, but typically those are expensive and not always easily scalable.
Then we heard about Prometheus… Even there are few comparable alternatives (Graphite, InfluxDB, OpenTSDB, Nagios, etc.), seems that Prometheus monitoring is becoming the industry standard.
Prometheus is a free software application used for event monitoring and alerting. It records real-time metrics in a time series database built using a HTTP pull model, with flexible queries and real-time alerting. Prometheus is manageable, reliable, scalable, and easy to integrate with ( https://prometheus.io/docs/instrumenting/exporters ). Prometheus works well for recording any purely numeric time series. It fits both machine-centric monitoring as well as monitoring of highly dynamic service-oriented architectures.
Prometheus is great but has a few shortcomings, Thanos resolves these. Thanos is a highly available Prometheus setup with long-term storage capabilities. Thanos features object storage for an unlimited time in reliable and cost-efficient way and is heavily compatible with Prometheus and other tools that support it, such as Grafana. Thanos allows you to aggregate data from multiple Prometheus instances and query them, all from a single endpoint. Thanos also automatically deals with duplicate metrics that may arise from multiple Prometheus instances.
Prometheus and Thanos are still not known that widely, but more and more big companies have started to rely on them. When we decided to try Prometheus/Thanos some time ago, initially we thought it could be complicated to get everything up and running from scratch. You can’t find many “how-to” articles or troubleshooting steps in the web. If you’re not familiar with Linux, it’s even more problematic. That’s why we decided to publish this article, which will help to build your own Prometheus/Thanos cluster lab in automated way, so you could play around with main components and query metrics you’re exporting.
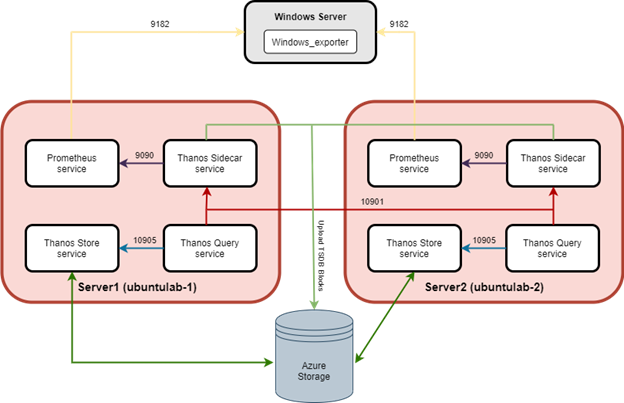
Let’s assume, we want to monitor specific Windows server metrics. Using Terraform, we will create 2 Ubuntu Linux servers in Azure. Using PowerShell DSC, these VMs will be configured as two identical nodes, running Prometheus, Thanos Sidecar, Thanos Query and Thanos Store services. Simple architecture diagram below:
Exporter
As mentioned in the link above, Prometheus has lots of exporters and integrations. At this case we’ll use “Windows_Exporter”, which should be installed to monitored Windows machine. All the details and installation files can be found in the https://github.com/prometheus-community/windows_exporter . Recommendation is to install the installer using msiexec, because not all metric collectors are enabled by default and some default collectors may not be needed at specific cases. Below is example how to install choosing specific metric collectors and make sure "windows_exporter" service is running after all:
msiexec /i C:\Temp\windows_exporter-0.16.0-amd64.msi ENABLED_COLLECTORS="cpu,cs,logical_disk,net,os,service,system,memory,terminal_services,tcp,logon" LISTEN_PORT="9182"
Linux servers for monitoring infrastructure
We’ll not get too much into the details here. Process is straightforward and Linux VM’s can be installed manually via Azure portal or using PowerShell/Azure CLI. If you use different cloud provider or even on-prem servers, make sure you have 2 Linux servers ready with PowerShell, OMI and DSC installed and skip to the next chapter.
We prefer "Infrastructure as Code" approach. Terraform configuration files with some explanations in the comments, can be found in the below Github repository:
https://github.com/AppDSConsult/PrometheusThanosLab/tree/master/Terraform-VM-build
Please modify variables.tf and main.tf contents to match your situation. Some main.tf sections are commented out, so you could use them later if needed. For example, new virtual network/subnet are not needed, so comment those resources out and use “Import existing vnet/subnet” resource, adding required variables as well. Code files briefly explained below:
variables.tf - modify variables.tf to match Azure infrastructure and required VM's details. Add subscription_id, client_id, client_secret and tenant_id sensitive variables for Azure Service Principal with sufficient permissions to create Azure resources.
main.tf - Linux VM build terraform code. We use “Ubuntu Server 20.04 LTS” at this case, but “storage_image_reference” can be modified if other OS or version is needed. For PowerShell Desired State Configuration (DSC) to work properly on Linux - PowerShell, OMI and DSC are being installed as well, using Azure VM extension.
script.sh - script to install PowerShell, Open Management Infrastructure (OMI) and PowerShell DSC. Modify accordingly to adapt required Linux version or package updates.
PowerShell DSC configuration scripts overview
PowerShell DSC scripts for configuring Prometheus and Thanos can be found in the below Github repository:
https://github.com/AppDSConsult/PrometheusThanosLab/tree/master/DSC-Config
Let’s review configuration scripts and what they do:
Initiate-Session.ps1 - Configuration documents (MOF files) can be pushed to the Linux computer using the Start-DscConfiguration cmdlet. To use this cmdlet, along with the Get-DscConfiguration, or Test-DscConfiguration cmdlets, remotely to a Linux computer, you must use a CIMSession. The New-CimSession cmdlet is used to create a CIMSession to the Linux computer. IMPORTANT - For "Push" mode, the user credential must be the ”root” user on the Linux computer. If you don’t know the ”root” user password, which may be the case with VM from Azure image, please change it.
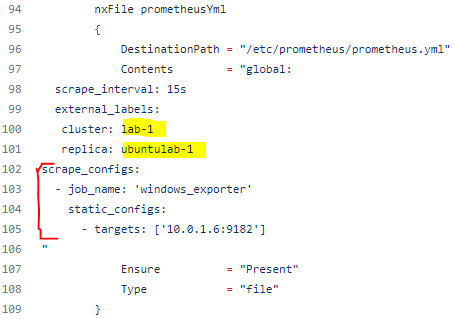
prometheusConfig.ps1 - downloads, installs, and configures running Prometheus service on Linux VM. Pay attention to "nxFile prometheusYml" DSC resource - contents must be modified depending on monitored VMs or instances exporter information. cluster and replica can be modified to anything you want, but each Prometheus cluster node (replica) must have different name to distinguish those servers in the Thanos Query console. Make sure required Prometheus exporters are installed to monitored VMs. Prometheus.service file contents are being downloaded from Github as file is not being modified often.
sidecarConfig.ps1 - downloads, installs, and configures running Thanos Sidecar service on Linux VM. Same as on other config scripts, adjust package versions if newer is released. Make sure you're connected to Azure subscription via terminal, as existing Storage account details are required to create bucket.yml config file that contains Azure object store configuration for uploading TSDB blocks to. Sidecar.service file contents are being downloaded from Github as file is not being modified often.
storeConfig.ps1 - downloads, installs, and configures running Thanos Store service on Linux VM. Make sure you're connected to Azure subscription via terminal, as existing Storage account details are required to create bucket.yml config file that contains Azure object store configuration for uploading TSDB blocks to. Store.service file contents are being downloaded from Github as file is not being modified often.
queryConfig.ps1 - downloads, installs, and configures running Thanos Query service on Linux VM. Query.service file contents must be adjusted manually to match each Thanos Sidecar server node as a store. When Thanos Store (Store Gateway) component is used, additional store should be added to match Thanos Store server name/IP, so metrics from Azure bucket could be queried.
Prometheus and Thanos components configuration using PowerShell DSC
Let’s start configuring two Prometheus/Thanos server nodes.
- Run Initiate-Session.ps1 from any Windows server, which has network access to Prometheus/Thanos Linux servers we want to configure. Make sure “$Node” variable modified to VM server name or IP address to which DSC config should be pushed. In our example lab, IP address of 1st server node is 10.0.8.4. Once we have session parameters, remaining scripts can be executed on 1st Prometheus/Thanos server.
- Let’s modify and run prometheusConfig.ps1. Same as for all remaining scripts, make sure node name or IP is correct. Very important part is to modify “external_labels” in the "nxFile prometheusYml" DSC resource. We’ll keep same cluster name (lab-1) on both nodes, but replica (ubuntulab-1 or ubuntulab-2) should be different on each Prometheus/Thanos server nodes to distinguish those servers in the Thanos Query console and for deduplication as well. In the "scrape_configs -> targets" section define monitored Windows server's hostnames/IP's and windows_exporter port.
To broaden monitoring with different metrics/exporters, just add additional job under "scrape_configs" with similar structure:
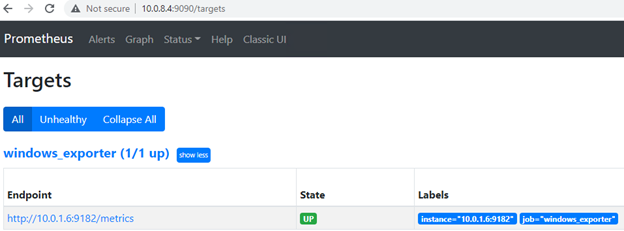
Save and run. If all went well, prometheus.service should be running, port 9090 should be listening and Prometheus console should be reachable via node IP address and same port:
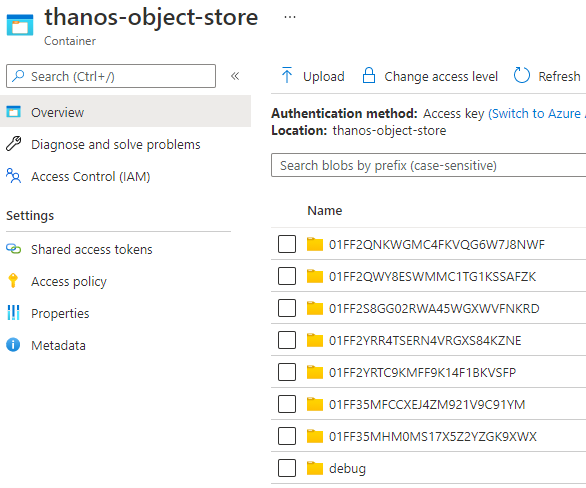
3. Make sure you have Azure Storage account and private Container pre-created. Same Container will be used for both nodes. Run sidecarConfig.ps1 and push configuration to 1st server node. If all went well, sidecar.service should be running, ports 10901 (grpc) and 10902 (http) listening. The thanos sidecar command runs a component that gets deployed along with a Prometheus instance. This allows sidecar to optionally upload metrics to object storage and allow Queriers to query Prometheus data with common, efficient StoreAPI. Each two hours, metrics are being uploaded to Azure storage container or can be checked in a detailed way using bucket inspect tool ( https://thanos.io/tip/components/tools.md/#bucket-inspect ).
4. Run storeConfig.ps1 and push configuration to same 1st server node. If all went well, store.service should be running, ports 10905 (grpc) and 10906 (http) listening. The thanos store command (also known as Store Gateway) implements the Store API on top of historical data in an object storage bucket (Azure Storage Container at this case). It acts primarily as an API gateway and therefore does not need significant amounts of local disk space.
5. Repeat same steps (1-4) on the Prometheus/Thanos 2nd server node. In our example lab, IP address of 2nd server node is 10.0.8.5. Modify each script to match 2nd server IP and do not forget replica (ubuntulab-2 or whatever you like) in the prometheusConfig.ps1.
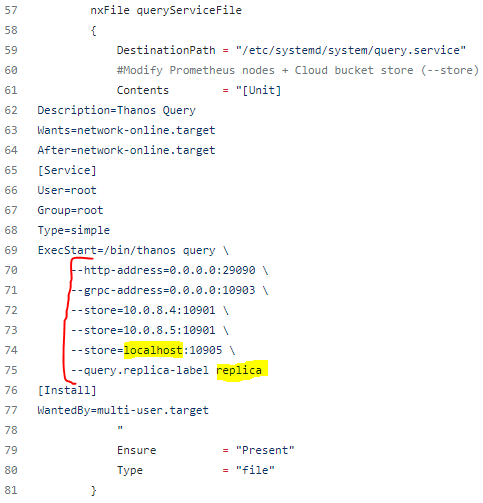
6. Once we have Prometheus, Thanos Sidecar and Thanos Store running on both nodes, let’s push Thanos Query config on both as well. query.service is being configured directly from queryConfig.ps1 script. Main idea is to add both Sidecar IP addresses as stores and the third store is the Store component, which we installed using storeConfig.ps1. “localhost” is used instead of IP, because this time, each node will point to locally installed Store component, which will query metrics from Azure storage. --query.replica-label replica means that we can filter and identify metrics using replica name defined in the prometheusConfig.ps1.
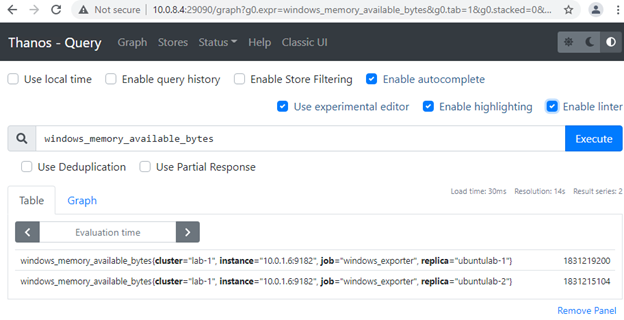
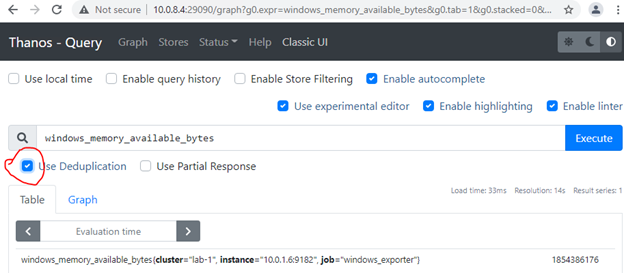
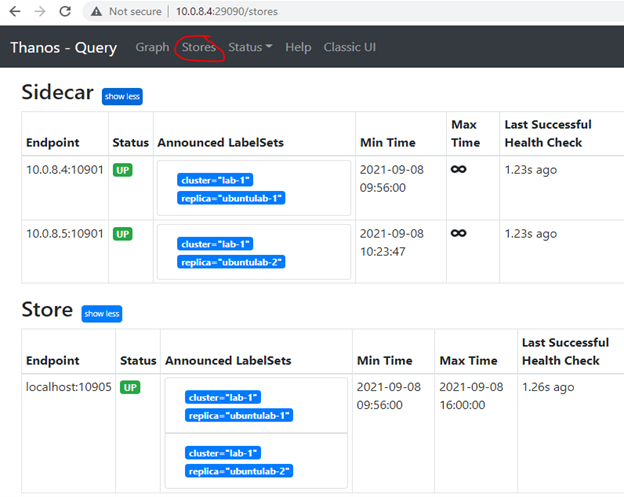
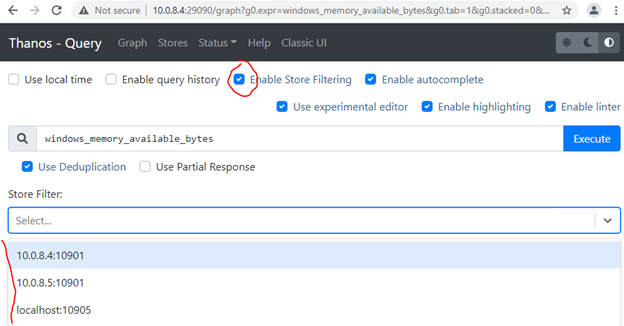
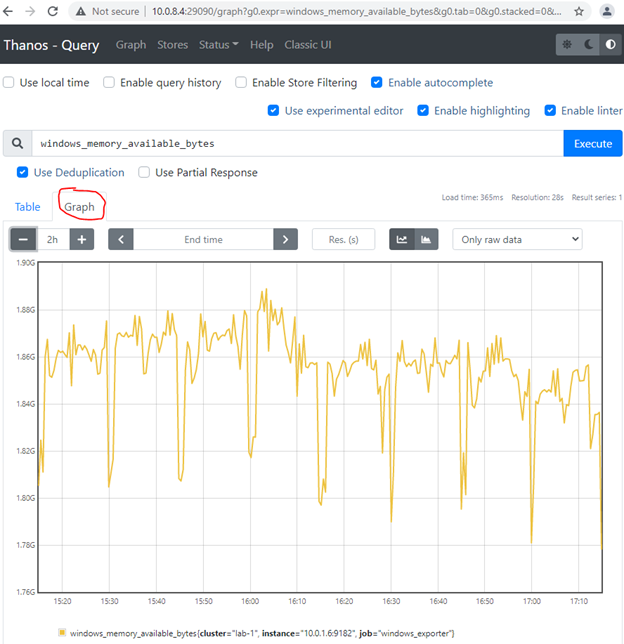
If all went well, query.service should be running, ports 10903 (grpc) and 29090 (http) listening. The thanos query command (also known as “Querier”) implements the Prometheus HTTP v1 API to query data in a Thanos cluster via PromQL. Thanos Query console should be reachable via node IP and 29090 port. You can use any of our node IPs to query metrics with and without deduplication and query/filter all the stores we configured:
We’ll not configure Thanos Compactor component, which compacts, downsamples and applies retention on the data stored in cloud storage bucket. Not much of a benefit, when monitoring only single server. In production environment, we strongly recommend using Thanos Compact. Compactor gives massive advantage on querying long ranges metrics. Additionally, it decreases monitoring infrastructure servers’ utilization. Thanos Compact is not designed to save storage and even increase storage consumption. But if properly designed and 5min or 1hour metrics resolution is enough for old metrics, storage can be saved significantly as well.
Final notes
For more technical details or to learn more how each component works, check out https://thanos.io/ and https://prometheus.io/ official web sites.
If you need help setting up Prometheus/Thanos monitoring environment or any other assistance, please contact us for free consultation https://www.appds.uk/contact-us or give us a call.